.avif)
Companies today are collecting exabytes of data across departments. But the irony is that most of them struggle with converting this goldmine of information into actionable insight. So, how do businesses and leaders stop being overwhelmed by waves of data? With business intelligence (BI), i.e., refining raw data and managing it to answer questions. Today, companies are using BI software to increase insight velocity. The most comprehensive software solution they’re going for is a BI dashboard, also known as a data or analytics dashboard.Many data-driven companies today have customized data dashboards across business units and management levels. These dashboards collate heaps of scattered data and present it as visualizations.
Why do companies use data dashboards?
Dashboards consolidate relevant information from across databases. This enables enterprises, leaders, and teams to:
1. Analyze business health in real-time and over time
Custom dashboards bring in data from across departments to give you a holistic view of business performance. This data can be viewed in real-time for tactical decision-making and over any specified duration for strategic course correction.
2. Identify opportunities and make decisions data-driven
Data dashboards give previously siloed data much greater structure, offering you visibility into any bottlenecks that can be optimized and positive trends that can be built upon. With this valuable intelligence in hand, you can make better business decisions.For instance, Molson Coors built its sales reps a mobile dashboard to have key data handy before speaking with clients or prospects. They didn’t have to manually sort and download data from Excel, saving time and reducing the risk of working with outdated data.
3. Enhance customer experiences
Dashboards can help companies improve omnichannel customer experiences. For instance, customer service dashboards can offer insight into key support metrics such as customer satisfaction (CSAT), internal quality score (IQS), number of new and closed tickets, agent-wise customer ratings, average response times, and others.Dashboards can also track data such as customer churn rate and correlate it with customer cohorts to help businesses identify issues and resolve them at the earliest.
4. Improve data governance and save analysis time
Enterprises collect a lot of data across departments. But this data tends to be scattered. As a result, leaders can be overwhelmed by mounds of data without context. This is what 2 out of 3 marketers across major countries feel is stopping them from making data-driven decisions.Dashboards can help leaders make greater sense of data by improving data governance. They collate data, visualize it, and help leaders (and their teams) connect the dots and save analysis time.Also Related: 20 Vital Metrics to Track on Your Dashboard
What are the types of custom dashboards you can build?
When building a dashboard, consider what problem you’re trying to solve and who you’re trying to solve it for. You may need a dashboard to help senior-level management make better decisions, or you may need one to help your HR team manage talent more effectively. Many eCommerce companies also use dashboards to track logistics and procurement. Depending on the use cases, you can choose from the four overarching dashboard types.
1. Strategic dashboard
These are high-level dashboards that are usually accessible to senior management of a company.
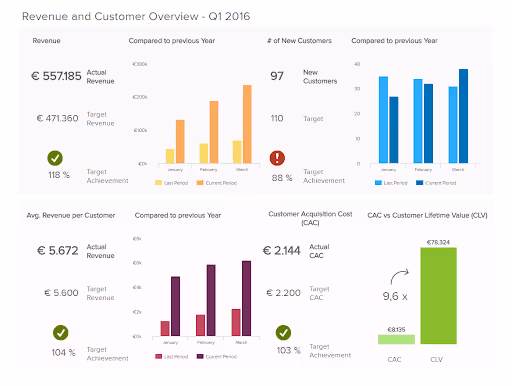
Source: DatapineSuch a dashboard will compile enterprise-wide data and summarize it over specific time frames, such as a month, a quarter, or a year. This presents decision-makers with all the information they need to study business performance, identify concerns, and quickly make strategic adjustments.
2. Operational dashboard
These dashboards track operational performance and are primarily used by junior managers and other subject matter experts across departments.
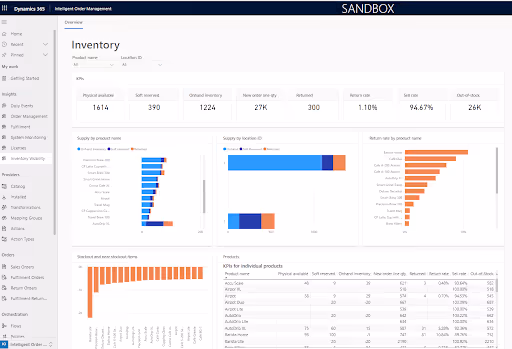
Source: MicrosoftOperational dashboards present data in real-time as well as over time. This helps teams stay on top of any issues that may arise and optimize processes.For instance, Amazon Web Services teams use dashboards to track “day-to-day software deliveries and operational activities, such as designing, coding, building, testing, deploying, and scaling” their services.
3. Analytical dashboard
These dashboards, used by analysts to support middle management, help companies make sense of large volumes of broad data.A good example of an analytical dashboard is a supply chain management dashboard for a consumer goods company.
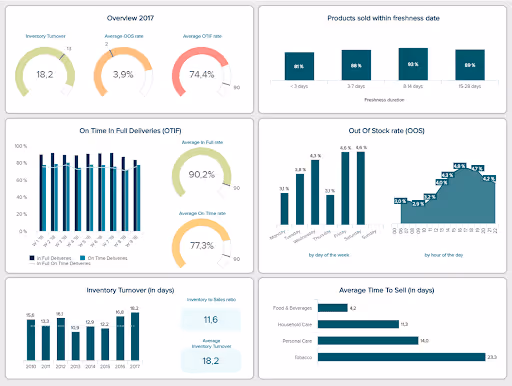
Source: Datapine Such a dashboard tracks supply chain KPIs around stock, inventory, and delivery, visualizing data to help executives stay ahead of any operational blockages and issues.
4. Tactical dashboard
These dashboards present more granular data on departmental performance.For instance, a social media dashboard can help digital marketers keep tabs on performance across platforms over specified periods. A great example of this is SproutSocial’s dashboard which offers a range of tactical data.
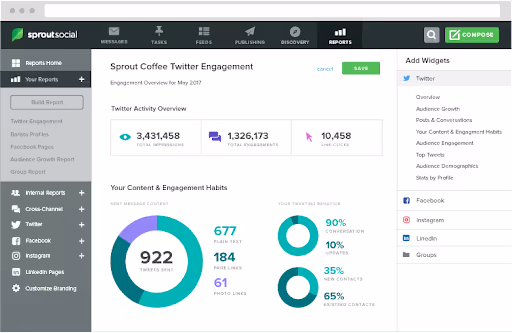
Source: SproutSocial In this example, the dashboard comprehensively drills down into a company’s platform-specific behavior as well as content and engagement habits.Also Read: How Experiential Data Can Help Create an Outstanding Customer Experience
What are the key features your dashboard must have?
1. Customizable interface
A dashboard must expand to fit all your business intelligence needs. This may not always be possible with off-the-shelf applications. This is why companies hire custom dashboard development company like us.We build flexible custom dashboards that can be easily customized to adapt to business needs. We also modify existing dashboards into more powerful tools that can take any shape you want.
2. Interactive visualization
Data visualization makes it very easy to identify patterns, trends, and anomalies in any data set. This is especially useful when working with large data sets.When building or choosing a BI dashboard, ensure that it can convert data into key visuals such as a variety of graphs, charts, and heat maps. These visuals must be interactive and easy to manipulate.
3. Data filters
Data filters are a standard feature of any good data dashboard. These filters allow users to zero in on required information by removing some scope of available data.Common filter types include hierarchical filters, multi-tab filters, advanced time filters, and negative filters.
4. Real-time updates
There’s nothing more relevant than real-time data. Live data is very valuable from a tactical standpoint as it makes teams much more responsive to anomalies as soon as they arise.
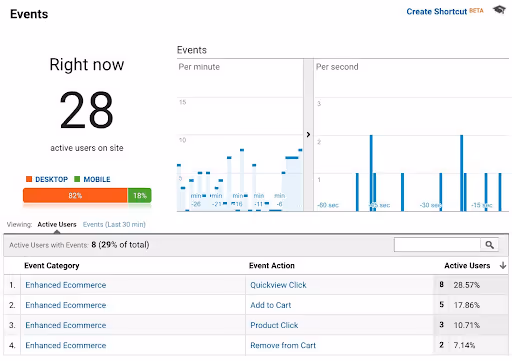
Source: MonsterInsightsThe most familiar example of real-time data is Google Analytics, which shows digital marketers live website traffic.
5. Cross-device accessibility
It’s not just your customers that are on mobile—your teams are too! In fact, your teams may be logging into work or analyzing data on a variety of devices. This is where cross-device compatibility comes in handy.When choosing a dashboard, ensure that the UI is accessible on any device. This will help your teams swiftly access data on the go from anywhere in the world.
6. Custom alerts functionality
The best dashboards don’t just improve decision-making and efficiency but also reduce the need for human beings to be involved at all. Unless necessary.Perpetual data monitoring is susceptible to human error. This is where companies must leave the analytics to computers and rely on intelligent data alerts. These custom intelligent alerts, which can be AI-driven or set up manually, can reduce human intervention and further improve operational efficiency.
7. User accessibility management
Data security is of paramount importance when working with dashboards. But security can be compromised when dashboard access is shared across teams and departments. This can be prevented with user accessibility management.The best enterprise-grade dashboards allow dashboard owners to share access across four levels: admin, editor, power viewer, and viewer, in increasing order of access restriction.
8. Data exporting and report generation
Some dashboards, such as high-level strategic dashboards, work with sensitive data and cannot be shared with other teams. For larger teams, sharing dashboards can also threaten data security. This is where reporting can be invaluable.
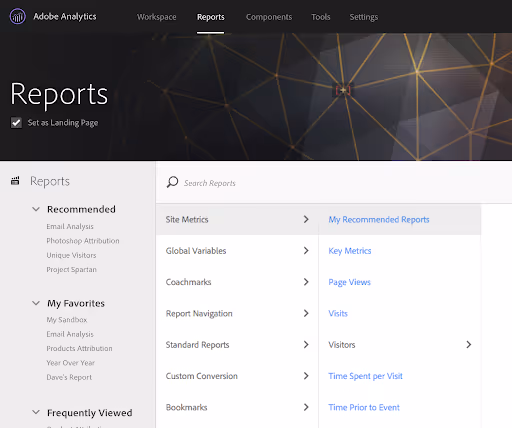
Source: AdobeDuring the custom dashboard development process, add a data exporting and report generation functionality. Here, users must be able to select the elements they would like to reflect in the reports/documents. Apart from these, many dashboards also offer good-to-have functionalities such as data drill-down and drill-through, embedding, language translation, and additional UI elements for even greater customizability.
Build powerful dashboards to arm your teams with data
For data-driven companies, business speed depends on insight velocity. With data becoming increasingly dynamic, delays and bottlenecks in generating business intelligence mean decisions based on intuition. And that’s risky.Dashboards remove intuition and replace it with data. They introduce self-service analytics to your teams and eliminate time wasted on procuring relevant data. As a result, teams across management levels are armed with data they can actually use to make logical decisions quickly. At Successive Technologies, we build powerful and highly customizable dashboards tailored to our client's unique business needs. Our solutions help companies across industries extract maximum value from data at a strategic and tactical level. Reach out to our solutions expert for a custom dashboard solution for your business!Read Next: Why Your Business Needs a Digital Experience Platform