A cloud-native application can appear healthy on infrastructure dashboards while users experience slow transactions or failed requests. Across distributed services, databases and external dependencies, an alert may identify a symptom without explaining its cause.
Monitoring evaluates selected signals to detect changes and trigger alerts. Observability is the ability to understand system behavior through available telemetry. Together, they help teams detect problems, investigate causes and assess user impact.
In cloud native application development, effective visibility starts with instrumentation and context during development, then evolves through production experience. Tools support this work, but their usefulness depends on the evidence applications and infrastructure provide.
Monitoring and Observability Work Together
Monitoring might alert a team that checkout latency has exceeded its target. Observability enables engineers to follow affected requests, compare successful and failed transactions, and investigate contributing dependencies or recent changes.
| Dimension | Monitoring | Observability |
| Primary purpose | Track conditions and detect changes requiring attention. | Investigate behavior, causes and impact. |
| Typical questions | Has latency increased? Are errors exceeding the target? | Which requests are affected? Where is time spent? |
| Evidence | Metrics, logs, traces, health checks and synthetic tests. | Relevant telemetry connected through request, service and deployment context. |
| Working approach | Dashboards, checks, thresholds and anomaly detection. | Exploratory queries, tracing and comparisons across components and time. |
Both apply to monoliths and distributed applications. As dependencies and change frequency increase, teams need stronger correlation across service boundaries. Instrumentation depth should reflect critical user journeys and incident risk.
Also Read: Monitoring Is Not Operating: Why Observability Alone Does Not Reduce MTTR
Design Observability Into Engineering Delivery
During development, including through cloud native development services, decide which requests, dependencies, errors and business events require instrumentation. Establish naming conventions, service metadata and trace-context propagation so evidence remains understandable across teams.
Automatic instrumentation can cover supported frameworks and infrastructure, but custom application logic may need additional spans or structured events. A platform may detect a slow order-processing request without identifying the business stage responsible.
In cloud native application development services, agree collection, sampling, security and retention policies alongside instrumentation. Validate the result through realistic failure tests: can engineers trace a failed transaction, identify affected dependencies and find the relevant application version?
Existing applications built through cloud app development services can improve incrementally. Start with critical journeys and recurring incidents, then address the gaps that most impede investigation. Adding instrumentation later may require testing and coordinated releases, which DevOps automation can support, but improvements remain possible throughout the application lifecycle.
Why Full-Stack Visibility Matters
A service can pass its health checks while a transaction fails elsewhere. Application code, databases, queues and external APIs may all contribute, with ownership spread across teams.
Full-stack visibility connects relevant evidence across the user experience, application services, data stores and infrastructure. It helps teams distinguish local symptoms from wider problems and assess which workflows are affected.
Diagnostic delays can extend business disruption. Track time to detect, mitigate and restore service alongside transaction success rates and the duration of user impact. Review coverage as dependencies, deployments and operating conditions change.
Establish a baseline before expanding the implementation. Compare investigation outcomes for priority services and check whether engineers can answer the questions that previously required manual reconstruction. Improvements should be judged through operational evidence and user impact, alongside the cost of maintaining the capability.
The Building Blocks of Full-Stack Observability
OpenTelemetry provides a vendor-neutral framework for instrumenting applications and generating, collecting and exporting telemetry. It works with analysis backends rather than replacing them.
Five signals and capabilities provide a practical foundation:
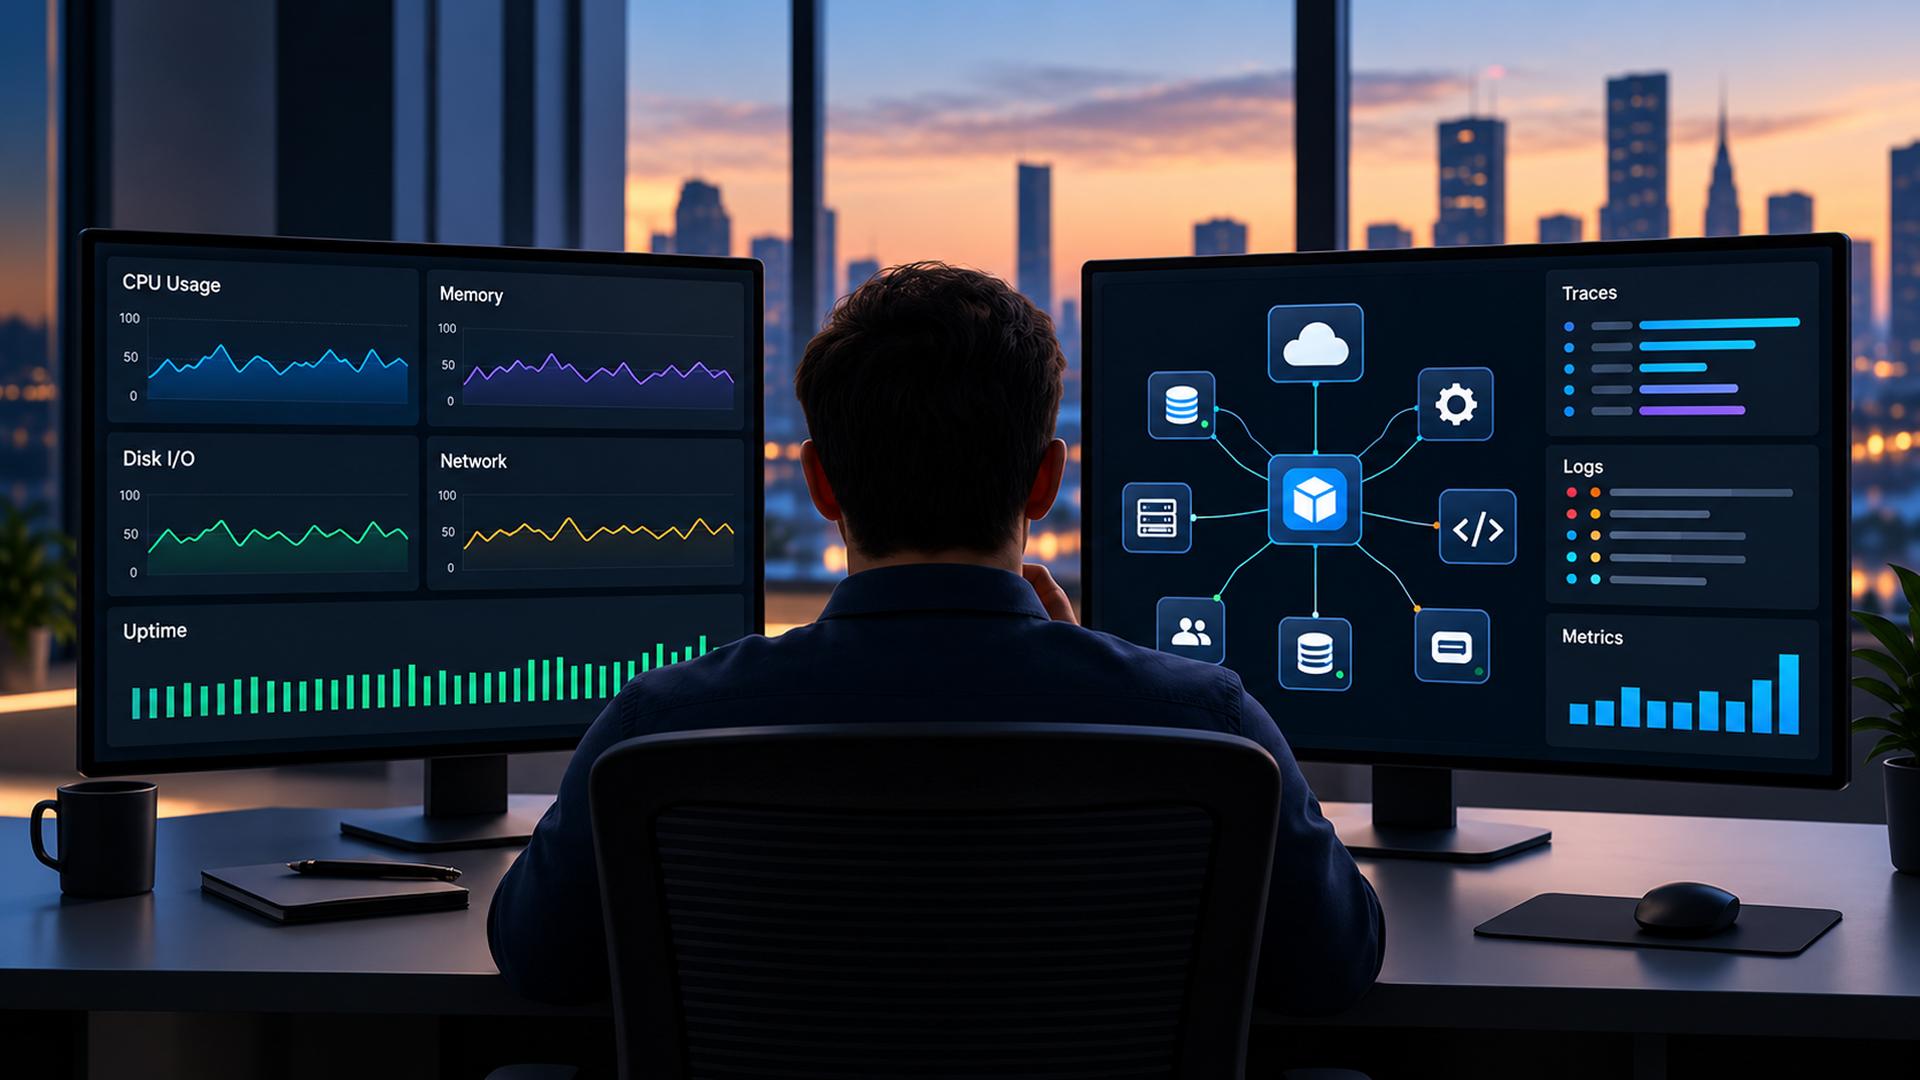
- Metrics: Measurements such as request rates, latency, errors and resource utilization reveal trends and performance against targets.
- Logs and events: Records of activity, errors and deployments provide detail. Structured fields and relevant identifiers make them easier to search.
- Distributed traces: Related spans describe operations along a request or workflow, helping teams investigate timing, errors and dependencies.
- Correlation and context: Trace identifiers, service metadata and deployment information connect evidence. Metrics provide aggregate context; linked traces and logs support detailed investigation.
- Alerting and response: Rules evaluate signals and route actionable notifications to accountable teams with sufficient context to begin investigation.
Additional evidence, such as profiling data or real-user measurements, may be needed for particular workloads. Select signals according to diagnostic questions rather than collecting everything by default.
How AI and AIOps Support Investigation
AIOps applies AI and machine learning to operational data to support detection, correlation and diagnosis. Useful applications include:
- Anomaly detection: Identify departures from expected behavior. Teams must distinguish faults from legitimate demand or deployment changes.
- Event correlation: Group related alerts using timing, dependencies and shared attributes, reducing duplicate notifications without hiding relevant evidence.
- Root-cause investigation: Highlight probable contributing causes using telemetry, dependency context and recent changes. Engineers validate findings before responding.
- Forecasting: Estimate trends such as capacity exhaustion when historical patterns support useful predictions. Evaluate accuracy and actionable lead time.
Generative AI can help query telemetry, summarize incidents and retrieve runbooks. Supporting evidence should remain accessible for verification. Define which responses may be automated and which require approval, particularly where changes affect production availability or data.
Evaluate AI assistance against actionable-alert rates, diagnostic accuracy and time to mitigate. Reliable telemetry and current operational context remain essential; neither AI analysis nor correlation guarantees a correct diagnosis.
Managing Common Challenges
| Challenge | Practical response |
| Fragmented telemetry | Establish shared conventions and managed collection pipelines; use OpenTelemetry where appropriate. |
| High cardinality and rising cost | Control metric dimensions, filter unnecessary records, sample traces appropriately and retain data according to value. |
| Instrumentation gaps | Combine automatic and custom instrumentation with dependency checks and synthetic tests; document coverage limits. |
| Alert fatigue | Prioritize user impact, tune and deduplicate alerts, assign owners and maintain runbooks. |
| Sensitive information | Define permitted fields, redact confidential content and enforce access and retention controls. |
| Unclear ownership | Assign responsibility for instrumentation, pipeline health, response and ongoing improvement. |
Review telemetry loss, coverage, alert usefulness and cost against critical journeys. Collection pipelines also need monitoring: missing or delayed telemetry can undermine investigation even when application instrumentation is sound.
Establish an Enterprise Operating Model
Organization-wide standards should work alongside service-level accountability. Service teams maintain application instrumentation and response procedures; platform teams manage shared collection capabilities. Escalation paths, often owned by site reliability engineering teams, clarify responsibility when incidents cross boundaries.
Set access and retention requirements according to data sensitivity, business needs and applicable obligations. Operational logs should not automatically be treated as complete audit trails. Attribute usage and spending to accountable teams through FinOps practices, and review budgets against service criticality and diagnostic value.
Allow documented exceptions for legacy systems awaiting application modernization, regional constraints or specialized workloads. The objective is consistent diagnostic capability, supported by release checks and incident reviews, with implementations suited to each environment.
Choosing an Observability Consulting Partner
Evaluate a cloud native application development company through evidence of engineering delivery, operational handover and measurable improvement. Ask cloud native consulting services providers for examples of instrumentation across critical journeys, validation through failure testing, and collaboration with development and SRE teams.
Assess compatibility with existing tools and technologies such as OpenTelemetry and Prometheus when selecting cloud native app development services. Examine how changing platforms would affect collection, queries and dashboards. Confirm responsibilities with any cloud application development company for cost controls, sensitive information, documentation and ongoing maintenance.
Use a priority service to test the approach proposed by any cloud native development company. Ask how an issue would be detected, investigated and routed, and which visibility gaps would remain.
How Successive Approaches Cloud-Native Observability
As a leading cloud consulting company, Successive provides cloud-native software development services that help enterprises establish observability during application development and improve visibility across existing systems. The approach starts with critical journeys, dependencies and the evidence teams need to investigate user impact.
In cloud-native application development for enterprises, instrumentation and collection are developed alongside ownership, security and cost controls. Where appropriate, AIOps supports detection and investigation, with findings validated and automated actions governed by defined permissions.
Contact Successive to discuss cloud application development services, beginning with an observability maturity assessment. Identify priority coverage gaps and establish a phased plan to improve instrumentation, alerting and incident investigation.
FAQs
What is the difference between monitoring and observability?
Monitoring tracks predefined metrics against known thresholds and alerts when they are breached. Observability lets teams investigate unknown issues by correlating metrics, logs and traces. Monitoring watches for known problems, observability explores unexpected ones.
Is observability something you build in or add later?
It is designed in. Observability is an engineering decision about how much telemetry a system emits, made during architecture and development. A platform added after launch can only show what the code already exposes, so deciding late leaves permanent blind spots.
Is observability a replacement for monitoring?
No. They are complementary layers. Monitoring remains the baseline for known signals, while observability adds the ability to investigate novel failures. Mature cloud-native systems run both rather than choosing one.
What are the three pillars of observability?
Metrics, logs and traces. Metrics show quantitative health, logs record structured events and traces follow a request across services. Correlating the three is what makes them useful together.
What is AIOps and how does it relate to observability?
AIOps applies machine learning to observability data. It detects anomalies at scale, correlates related alerts into single incidents, automates root-cause analysis and predicts degradation before an outage. It depends on good telemetry, so it relies on observability being designed in from the start.
Does AI replace engineers in observability?
No. AIOps handles the scale of telemetry humans cannot read and surfaces probable causes faster. Engineers keep oversight on high-impact decisions and on validating what the models flag. AI reduces the manual load rather than removing the judgment.
Why is observability harder to achieve in microservices architectures?
Requests cross many independent, ephemeral services, so a failure can hide between them while each service looks healthy. Making that visible needs distributed tracing and structured, high-cardinality telemetry that a monolith rarely requires.
What tools are commonly used for cloud-native observability?
Open standards such as OpenTelemetry for instrumentation and Prometheus for metrics are common, alongside tracing tools, log platforms and AIOps engines. OpenTelemetry, a CNCF project, is increasingly the vendor-neutral default for collecting telemetry.
Does observability help reduce downtime and MTTR?
Yes. By making cross-service failures visible and letting engineers query live and historical data, observability shortens the time to locate a fault. AIOps shortens it further by narrowing probable causes automatically.
Should observability be built in-house or handled by a development partner?
Both work. Build in-house if the effort is keeping pace with delivery. Bring in a cloud-native development partner when the tuning burden slows feature work or observability trails each new service.